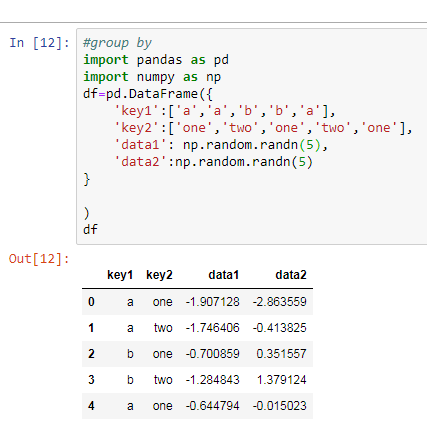
Data Wrangling: Joins
Joins (Merge):
We merge or join two DataFrames by using merge().
Merge operation is similar to Join operation in SQL. DataFrames must have same column names on which merging happens.
Arguments to merge() allows us to perform natural join, left join, right join and full outer join:-
Types of Merge:
Venn Diagrams for better understanding:
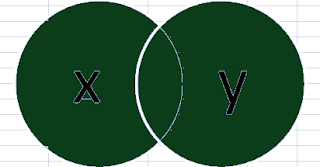
1. Natural Join:

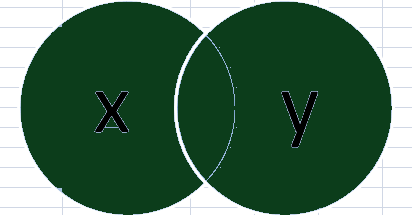
2. Full-Outer Join:
3. Right-Outer Join:

Click this for Join Example
Arguments to merge() allows us to perform natural join, left join, right join and full outer join:-
-left: DataFrame1
-right: DataFrame2
-on: col names to join. Must be found in both left and right DataFrame objects.
- how: type of join needs to be performed left, right, outer, inner. Default is inner join.
Types of Merge:
- Natural Join: Keeps all rows that match from the DataFrames.
how='inner' - Full Outer Join: Kep all rows from both DataFrame.
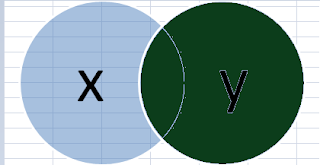
how='outer' - Left Outer Join: Keeps all rows of DataFrame x and only hose from y that match.
how='left' - Right Outer Join: Keep all rows of DataFramse y and only those from x that match,
how='right'
Venn Diagrams for better understanding:
1. Natural Join:

2. Full-Outer Join:
3. Right-Outer Join:

4. Left-Outer Join:

Click this for Join Example