Data Structures in Python
Python deals with three data
structure:
- DataFrames.
- Series.
- Panel.
DataFrame:
DataFrame is somewhere between SQL
table and Excel spreadsheet. The whole concept of Pandas is to do what we do in
SQL and Excel. It's a library. DataFrame is a two-dimensional array and is
represented in the tabular format.
I. To
define DataFrame, pandas should be imported.
Below are a few examples:
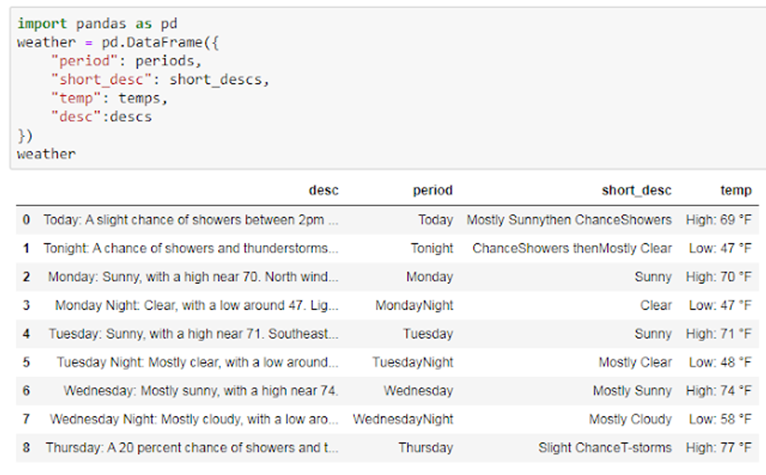
First, create a dictionary:
1. Convert dictionary into
DataFrame:

2. To check the type
of frame:

3. To access what is
inside the DataFrame: [This is equivalent
to select state from data;]

4. To access it in
frame:

5. To access it in
table format: [This is equivalent
to select state from frame;]

6. To change the name
of the column: Here the indexing is
changed from number to words

7. To check the type of
column:

8. To check the type
of index;

9. To give value to
column:

Summary for DataFrames:
----Two ways to convert into DataFrames----
1. frame1[['data']]
2. pd.DataFrame(frame2.data)
II. Filtering DataFrames
Indexing in Pandas Python is done with the help of loc ,
iloc and ix.
1. loc
(explicit) : used for indexing or selecting based on name i.e by row name
and column name.

2. iloc (implicit) :
used for indexing or selecting based on position i.e by row number and column
number (index starts with Zero).

3. ix :
indexing can be done by both position and name using ix.

Series:
Series is one-dimensional array capable holding data of any type(integer, string, float, python objects etc). An example of Series is one column of a DataFrame.
Series is one-dimensional array capable holding data of any type(integer, string, float, python objects etc). An example of Series is one column of a DataFrame.
Below are basic operations on Pandas Series:
- Creating a Pandas Series.
- Accessing elements of Series.
- Indexing and Selecting Data in Series.
- Conversion operation on Series.
1. Creating a Pandas Series: Pandas Series can be created by loading datasets from existing storage and storage cn be SQL Database, CSV file and Excel file. Pandas Series can be created from the lists, dictionary, and from a scalar value.
a. creating a series from array:

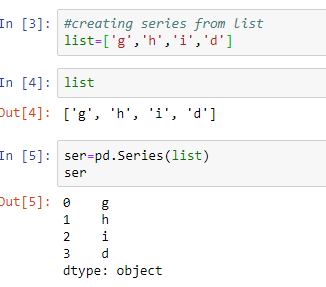
b. creating a series from lists:
2. Accessing elements of Series: There two ways to access elements:
a. accessing elements from Series with Position:

b. accessing elements from Series using Label(index):

3. Indexing and Selecting Data in Series: It means selecting particular data from a Series. Indexing is also known as Subset Selection.

a. indexing a Series using indexing operator []:

b. indexing s Series using .loc[]:

c. indexing a Series using .iloc[]:

4. Conversion operation on Series: In conversion operation, we perform various operations like changing datatype of series, changing a series to list etc. To perform these operations, there are various functions like .astype() , .tolist() etc.
a. to convert a datatype to series:


Panels: a. creating a series from array:
2. Accessing elements of Series: There two ways to access elements:
a. accessing elements from Series with Position:
3. Indexing and Selecting Data in Series: It means selecting particular data from a Series. Indexing is also known as Subset Selection.
4. Conversion operation on Series: In conversion operation, we perform various operations like changing datatype of series, changing a series to list etc. To perform these operations, there are various functions like .astype() , .tolist() etc.
a. to convert a datatype to series:
Panel is an important container for data which is 3-dimensional. It is basically used less. The names for the 3 axes are intended to give some semantic meaning to describe operations involving panel data and econometric analysis of panel data.
Syntax:


1. Create Panel: A panel can be created in the following ways-
Syntax:
pandas.Panel(data, items, major_axis, minor_axis, dtype, copy)where,
data: Data takes various forms like ndarray, series, map, lists, dict, constants, and also another DataFrame.
items: axis=0
major_axis: axis=1
minor_axis: axis=2
dtype: Data type of each column
copy: Copy ata, default-False.Below are basic operations on Pandas Series:
- Create Panel.
- Selecting the data from Panel.
a. from ndarrays:


Empty Panel looks like:
b. from dict to DataFrame:

2. Selecting the Data from Panel: Select the data from the panel using-
a. items:

We have two items, and we retrieved item1. The result is a DataFrame with 4 rows and 2 columns, which are the Major_axis and Minor_axis dimensions respectively.
b. major_axis:

c. minor_axis:

-------------------------------------------------------------------------------------------------------------------------


